Uber NYC - a Python project
Due to the rising cost of living, Uber senior managers think they should adjust trip prices accordingly. However, they fear this decision might be unpopular and drive away customers. They want to understand how their clients use Uber, to make data-based decisions.

Key questions to answer:
-
Which are the busiest days and hours.
-
Create simpler trips price profiling.
-
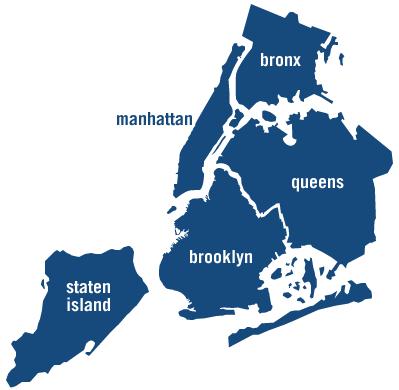
Check which borough is the busiest pickup point
-
Verify customers' trend of behaviour.

Key insights found:
-
Around 87% of trips were short. It seems Uber users consider this an affordable option for commuting.
-
The average trip length on Uber is between 2.5 and 3 miles long, and the average spent is around $14 dollars.
-
Performance varies from borough to borough, but all locations display a peak time for trips between 7:00 to 8:00 AM.
-
Almost 80% of all trip passengers are 1 or 2 individuals.

Key suggestions proposed:
-
Consider limiting payment to an electronic format, and in advance. Either credit/debit card or online payment such as PayPal and Klarna.
-
5) Build a decision-tree algorithm in the app, which will adjust the price in the following way: weekday or weekend => day time or night time => time of the day (peak times or off-peak) => number of passengers.
-
7) In the app, present the different car categories to the user, giving him/her the option to choose between cheaper options or more comfort (more expensive) cars.
For a dashboard presentation, please click here.
To view the entire project, please click here.